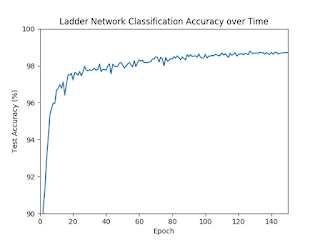
Today, Nate came back from the mountains to work in the lab. Welcome back Nate! I kept on doing the same work from last time. With the CAE experiment v.2 running in the background, I proofread and edited my section of the paper, and I worked with the ladder network for the rest of the day. First, I got rinuboney's implementation of the ladder network in TensorFlow ( github ) working in Python 3. Testing it with the MNIST dataset , I got the expected results (very good). Since we all love graphs, I quickly made one for said results. The idea is pretty simple. The ladder network is trained on 60,000 images of handwritten digits, 100 of which are labeled. The network makes predictions about the labels of 10,000 other images, and we calculate how accurate those predictions are. This process comprises 1 epoch, and is repeated 149 more times. By the end, the network achieves almost 99% accuracy. This is what we're hoping to do with HSI classification, but there seems to be an...
Comments
Post a Comment